The interpretation of the diagrams
If we are interested in distillation, both the vapour and the liquid compositions are of equal interest. It is therefore sensible to combine Figs. 6.7 and 6.8 into one (Fig. 6.9). The point a indicates the vapour pressure of a mixture of composition xA, and the point b indicates the composition of the vapour that is in equilibrium with the liquid at that pressure. Note that, when two phases are in equilibrium, P = 2 so F′=1 (as usual, the prime indicating that one degree of freedom, the temperature, has already been discarded). That is, if the composition is specified (so using up the only remaining degree of freedom), the pressure at which the two phases are in equilibrium is fixed. A richer interpretation of the phase diagram is obtained if we interpret the horizontal axis as showing the overall composition, zA, of the system. If the horizontal axis of the vapour pressure diagram is labelled with zA, then all the points down to the solid diagonal line in the graph correspond to a system that is under such high pressure that it contains only a liquid phase (the applied pressure is higher than the vapour pressure), so zA = xA, the composition of the liquid. On the other hand, all points below the lower curve correspond to a system that is under such low pressure that it contains only a vapour phase (the applied pressure is lower than the vapour pressure), so zA = yA. Points that lie between the two lines correspond to a system in which there are two phases present, one a liquid and the other a vapour. To see this interpretation, consider the effect of lowering the pressure on a liquid mixture of overall composition a in Fig. 6.10. The lowering of pressure can be achieved by drawing out a piston (Fig. 6.11). This degree of freedom is permitted by the phase rule because F′=2 when P = 1, and even if the composition is selected one degree of freedom remains. The changes to the system do not affect the overall composition, so the state of the system moves down the vertical line that passes through a. This vertical line is called an

Fig. 6.9 The dependence of the total vapour pressure of an ideal solution on the mole fraction of A in the entire system. A point between the two lines corresponds to both liquid and vapour being present; outside that region there is only one phase present. The mole fraction of A is denoted zA, as explained below.
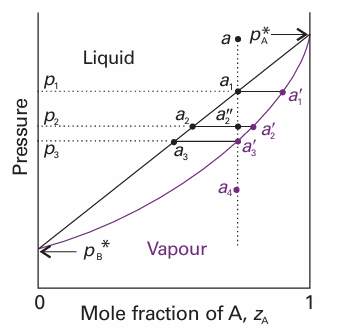
Fig. 6.10 The points of the pressure composition diagram discussed in the text. The vertical line through a is an isopleth, a line of constant composition of the entire system.
isopleth, from the Greek words for ‘equal abundance’. Until the point a1 is reached (when the pressure has been reduced to p1), the sample consists of a single liquid phase. At a1 the liquid can exist in equilibrium with its vapour. As we have seen, the composition of the vapour phase is given by point a1 ′. A line joining two points representing phases in equilibrium is called a tie line. The composition of the liquid is the same as initially (a1 lies on the isopleth through a), so we have to conclude that at this pressure there is virtually no vapour present; however, the tiny amount of vapour that is present has the composition a1 ′. Now consider the effect of lowering the pressure to p2, so taking the system to a pressure and overall composition represented by the point a2″. This new pressure is below the vapour pressure of the original liquid, so it vaporizes until the vapour pressure of the remaining liquid falls to p2. Now we know that the composition of such a liquid must be a2. Moreover, the composition of the vapour in equilibrium with that liquid must be given by the point a2 ′at the other end of the tie line. Note that two phases are now in equilibrium, so F′=1 for all points between the two lines; hence, for a given pressure (such as at p2) the variance is zero, and the vapour and liquid phases have fixed compositions (Fig. 6.12). If the pressure is reduced to p3, a similar readjustment in composition takes place, and now the compositions of the liquid and vapour are represented by the points a3 and a3 ′, respectively. The latter point corresponds to a system in which the composition of the vapour is the same as the overall composition, so we have to conclude that the amount of liquid present is now virtually zero, but the tiny amount of liquid present has the composition a3. A further decrease in pressure takes the system to the point a4; at this stage, only vapour is present and its composition is the same as the initial overall composition of the system (the composition of the original liquid).
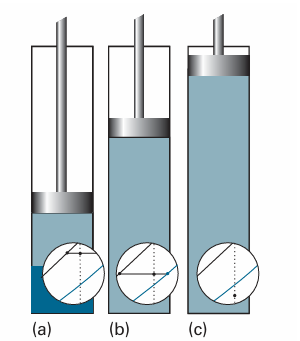
Fig. 6.11 (a) A liquid in a container exists in equilibrium with its vapour. The superimposed fragment of the phase diagram shows the compositions of the two phases and their abundances (by the lever rule). (b) When the pressure is changed by drawing out a piston, the compositions of the phases adjust as shown by the tie line in the phase diagram. (c) When the piston is pulled so far out that all the liquid has vaporized and only the vapour is present, the pressure falls as the piston is withdrawn and the point on the phase diagram moves into the one-phase region.


