Overview of NIR
As noted above, the near-infrared (NIR) region extends from about 800 to 2500 nm (or 12 500 to 4000 cm–1). NIR absorbances correspond to overtones and combinations of molecular vibrations that have their fundamentals in the mid IR region of the spectrum. The absorbances produced tend to be weaker than those for the mid IR. This can be put to good advantage in that samples may be measured without any need for sample dilution or preparation. For the qualitative analysis of solid samples, NIR spectra are invariably measured by reflectance (diffuse reflectance). The resultant spectra are considerably more complex to interpret than IR spectra, having many overlapping peaks. Computer algorithms are used to convert NIR reflectance spectra to a simpler form for interpretation with so-called ‘second-derivative’ spectra obtained (Fig. 1). Taking the second derivative of the spectrum largely removes the effects of baseline offsets and baseline slopes which are common in NIR spectra (Fig. 2). The positions of the negative peaks in the second-derivative spec trum correspond to the positions of peaks in the original spectrum as can be seen for acetonaphthone (Fig. 1). Peak positions (e.g. the six most intense) can be used as the basis of a method of quantification. The theory of NIR and the techniques used in spectral conversion are beyond the scope of this textbook and the reader is referred to Moffat et al. (2004) and to texts in the reference section of this chapter for more detailed discussion. Sampling techniques and the particular advantages offered by NIR compared to mid IR will be discussed here.
The strength of NIR lies in its ability to identify relatively pure samples rapidly or to identify a matrix of nearly fixed composition, such as tablets. Although this analysis could also be done in the mid IR, providing the same information, samples can be analysed by NIR in glass bottles (Fig. 3A), something which would not be possible for mid IR. This is because common types of glass such as borosilicate and soda glass are virtually transparent to NIR radiation. The radiation reflected by the sample is measured as afunction of wavelength and with respect to the reflectance of a suitable standard, such as a flat disc of a ceramic or Spectralon. Spectralon is a thermoplastic resin with very high diffuse reflection such that at NIR wavelengths it will have >95% reflectance. Spectra are dependent upon the reference chosen and the reproducibility of such standards can be a problem when it comes to transferability of spectra from one instrument to another. This problem has not been completely resolved at present. Fibre-optic probes that can be inserted directly into the sample can be attached to many NIR instruments (Fig. 3B). This makes it possible to sample directly from production lines.
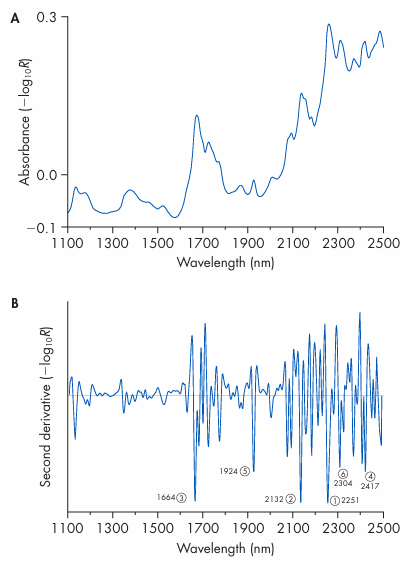
Figure 1 (A) Near-infrared spectrum of acetome-naphthone measured by reflectance; (B) second derivative spectrum of (A). Circled numbers indicate the six most intense negative peaks in order of decreasing intensity.
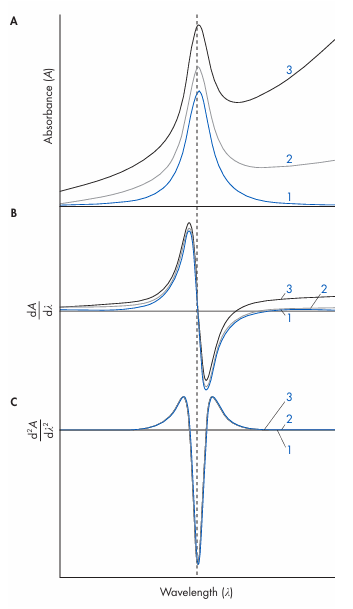
Figure 2 Advantages of using second-derivative spectra: (A) original spectra; (B) first-derivative spectra, and (C) second derivative spectra. 1, zero baseline; 2, linear sloping baseline; 3, curved (quadratic) baseline with offset.
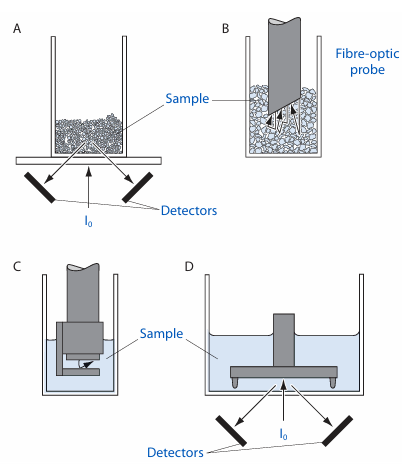
Figure 3 Sample presentation methods: (A) sample bottle on sample stage; (B) fibre-optic probe; (C) liquid sample using a fibre-optic probe fitted with transflectance adapter; and (D) liquid sample measured by transflectance.