Strength of molecular vibration absorption
Traditionally, an IR spectrum is reported as a plot of percentage transmittance (T%) against wavenumber v. The IR transmission spectrum of a polystyrene film used to calibrate the wavenumber scale is given in Figure 1.
The absorption of light in Fig. 1 is registered as the reduced transmission of light, i.e. a proportion of the incident radiation is absorbed by the sample. The non-absorbed radiation (transmitted) is detected by the detector. The simple ratio of the transmitted intensity to the incident intensity is known as the transmittance. The percentage transmittance is 100 times the transmittance (see Fig. 2).
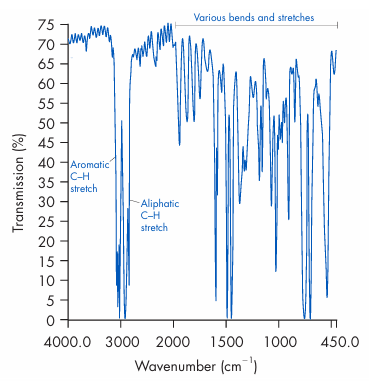
Figure 1 Transmission spectrum of a polystyrene film.
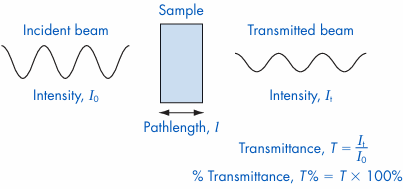
Figure 2 Transmission of light by a sample.
The absorption of light is quantified through Beer’s law as:

where A is the absorbance, c is the molar concentration, l is the pathlength of the sample and e is the molar absorption coefficient, also referred to as the molar extinction coefficient. Note that the terms I0 and It are used to differentiate between incident radiation (I0) and the transmitted radiation (It). Absorbance is the log of the inverse of transmittance:

The various vibrational modes have different tendencies to absorb, giving different molar extinction coefficients, and therefore they have different intensities in the spectrum. The carbonyl (C=O) stretch in the 1750 to 1650 cm1 range has a particularly strong transition electric dipole moment, and therefore e is large for a vibration (approximately 100) and the carbonyl absorption is a very prominent feature. The C=O stretch is said to be ‘allowed’ spectroscopically. The C-H stretching mode generates a lower transition electric dipole moment and the e value is smaller at ~10. However, there are usually many C-H bonds in a molecule and the additive absorption of these makes the C-H vibration a prominent feature. The stretches of symmetrical bonds, such as H-H (hydrogen gas), -C-C- (ethane), O-O (oxygen) and N-N (nitrogen), do not have a transition dipole moment and therefore ɛ →0 and these stretches are not observed and are said to be ‘forbidden’. Similar vibrations in complex molecules do absorb, but extremely weakly. On the other hand, gases such as NO, NO2, CO, CO2, SO2, CH4 and H2O (water vapour) do have IR-active vibrations that can be measured to monitor environmental levels. The low value of e and low concentrations of these gases mean that cells used in the analysis of gases by IR are very long (up to 1 m or more). Water vapour and CO2 present in the normal atmosphere produce absorption effects in an IR spectrometer in the absence or presence of a sample. High-precision work when determining IR spectra benefits from flushing the sample environment with dry air or nitrogen. The water vibrations centred at 3782 cm-1 and 1587 cm-1 show a fine structure associated with the rotations of the water molecule.
The actual movement of charge during a vibra tion is, in practice, very small and a value of e of approximately 200 is a practical upper limit. In tables of IR data, the intensity of a vibrational band is designated as vs (very strong), s (strong), m (medium) or w (weak) to reflect the variation in absorption coefficient (intensity of spectral feature). The measurement of IR intensity was unreliable for older designs of instrument, which made quantitative work in the IR unreliable. This is less true for modern instruments. The spectroscopic character of overtones and combinations is less well defined. Accordingly, e in the near IR is low and absorption is detected only for concentrated solutions with an absorption that may be too strong for spectral regions in which ɛ is larger. The molar absorption coefficient, ɛ, is largely responsible for determining the sensitivity of an analysis.