
آخر المواضيع المضافة

 النبات
الحيوان
الأحياء المجهرية
علم الأمراض
التقانة الإحيائية
التقنية الحيوية المكروبية
التقنية الحياتية النانوية
علم الأجنة
الأحياء الجزيئي
علم وظائف الأعضاء
الغدد
المضادات الحيوية
النبات
الحيوان
الأحياء المجهرية
علم الأمراض
التقانة الإحيائية
التقنية الحيوية المكروبية
التقنية الحياتية النانوية
علم الأجنة
الأحياء الجزيئي
علم وظائف الأعضاء
الغدد
المضادات الحيوية| Calculation of the results of multiple and single dilution test |


|
|
Read More
Date: 3-3-2016
Date: 13-3-2016
Date: 9-3-2016
|
Calculation of the results of multiple and single dilution test
The combination of positive tubes and negative tubes in the MPN technique allows estimating, by probability calculations, the density of the target microorganism(s) in the sample. The calculations may be performed using several formulas, but, for the combinations of positive and negative tubes that occur with greater frequency, the values have already been calculated and tabulated in MPN tables, making the use of formulas unnecessary. The combinations that occur less frequently are omitted from tabulation and, in these cases, the results can be calculated by formulas, though it is advisable to first repeat the test, to confirm the occurrence of the combination.
1 - Calculating the results of the multiple dilution test
1.1 Calculation using the MPN tables (for decimal dilutions)
Table MPN-1 of Annex 4.1 presents the results of a series of three tubes inoculated with aliquots of 0.1, 0.01 and 0.001 g or ml of sample. Table MPN-2 of Annex 4.1 presents the results of a series of five tubes inoculated with the same aliquots. For other aliquots, the same tables are used, with a conversion factor to multiply or divide the value read, as a function of the size of the inoculated aliquots. Observe that the dilutions are decimal and that the tables use the amount of sample in the aliquots, and not the inoculated dilution. For that reason, to facilitate use, Table 1 presents the correlation between inoculated dilutions and the quantity of sample in the aliquots, as well as the conversion factor to be applied to the result when the aliquots are different from those tabulated in the MPN tables. In addition to the estimate of the MPN/g or ml of the sample, the MPN tables also present, for each positive-negative tube combination, the upper limit and the lower limit of the MPN estimate, at the 95% level of confidence. This is the interval in which the actual (but unknown) number of microorganisms in the samples falls, in 95% of the cases.
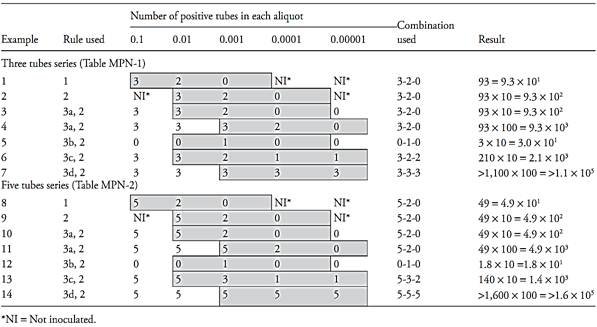
The rules for calculating the results, using examples from Table 2 are:
Rule 1. If the three inoculated dilutions correspond to the tabulated aliquots, the result is read directly in the row that corresponds to the combination of positive tubes obtained (Examples 1 and 8 of Table 2).
Rule 2. If the three inoculated dilutions do not correspond to the tabulated aliquots, the result read in the row that corresponds to the com-bination of positive tubes should be converted by applying the conversion factor of Table 1 (Examples 2 and 9 of Table 2).
Rule 3. If more than three dilutions were inoculated, rules one and two apply, but only three consecutive dilutions are considered.
3.a. If more than one dilution presented all tubes positive, the combination considered should contain the greatest dilution (smallest aliquot) presenting all tubes positive and the two consecutive dilutions (Examples 3, 4, 10 and 11 of Table 2).
3.b. If none of the dilutions presented all tubes positive, select the first three consecutive dilutions for which the middle dilution contains the positive tubes (Examples 5 and 12 of Table 2).
3.c. If a positive tube occurs in a higher dilution than the three selected, add the number of positive tubes in this dilution to the highest dilution of the three selected (Examples 6 and 13 of Table 2).
3.d. If all dilutions present all tubes positive, select the three highest dilutions (Examples 7 and 14 of Table 2).
Table 1 Guide for the use of the MPN tables.
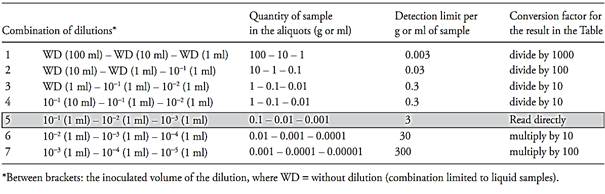
Table 2 Examples for use the MPN tables.
1.2 Calculating using the Thomas formula (for non-decimal dilutions)
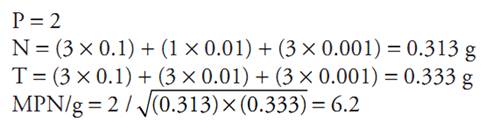
Thomas (1942) published a simplified formula for calculating the MPN, which can be used to calculate the results of samples inoculated in non-decimal dilutions. The formula can also be used for samples inoculated with decimal dilutions, however, the results of which were omitted from the MPN tables. The calculation by the formula allows to consider all inoculated dilutions, not only three. The results may not completely coincide with those obtained by applying the Halvorson & Ziegler formula (1933), which is the most widely used in the construction of MPN tables, but the difference is small and without practical consequences. The Thomas formula is presented below:
MPN/g ou 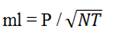
P = Number of positive tubes
N = Sum of the sample quantity inoculated in the nega-tive tubes
T = Sum of the sample quantity inoculated in all tubes
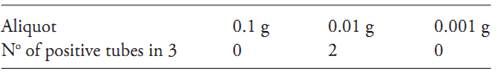
Example 1. Consider the aliquots and the combination of positive and negative tubes in the series of three tubes below:
1.3 Calculating the results for samples prepared by the surface swabbing or surface washing techniques
This is done in the same way as described for plate counts, however, where it says CFU, the abbreviation CFU should be replaced by MPN and, the term “plate count” should be replaced by the term “count by the MPN technique”.
2- Calculating the results of the single dilution test
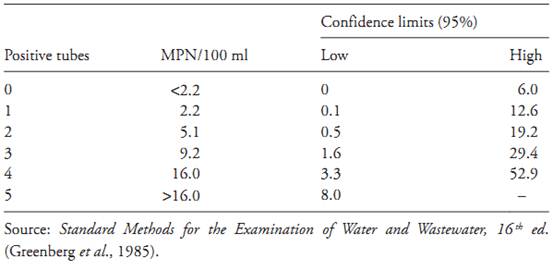
For the distribution of ten aliquots of 10 g or ml of the sample, the MPN-3 Table of the Annex 4.1 may be used. For the distribution of five aliquots of 20 g or ml of the sample, the MPN-4 table may be used and for five aliquots of 10 g or ml, the MPN-5 Table may be used. Considering the fact that the single dilution test is mainly applied for the examination of liquid samples with low contamination levels, the tables present the result in MPN/100 ml of sample. There is not, however, any restriction as to its use for solid samples if the same aliquots were inoculated, for example, 10 × 100 ml of the 10−1 dilution in 100 ml double-strength broth or direct inoculation of 10 × 10 g of the sample in the broth (if applicable) .
.2.1 Rules for calculations performed using the MPN-3 Table
Rule 1. To determine the MPN/100 ml or 100 g, in the inoculation of 10 × 10 ml or 10 × 10 g, it suffices to read the value in the row corresponding to the number of positive tubes obtained. Example 1: Inoculation of 10 × 10 ml of the sample yielded five positive tubes – MPN/100 ml 6.9= . Example 2: Inoculation of 10 × 10 g of the sample yielded three positive tubes –MPN/100 g = 3.6
Rule 2. To determine the result of the inoculation of ten aliquots containing amounts of sample different from 10 g or 10 ml, but still multiples of ten, it suffices to multiply (if the quantity was smaller than ten) or divide (if the quantity was greater than ten) the value read in the MPN-3 table. Example 3: Inoculation of 10 × 1 g of the sample yielded nine positive tubes –MPN/100 g = 23 × 10= 2.3 × 10². Example :4 Inoculation of 10 × 100 g of the sample yielded nine positive flasks – MPN/100 g = 23/10 = 2.3
Rule 3. To convert the result from MPN/100 ml or
MPN/100 g to MPN/ml or MPN/g, it suf-fices to divide the value by 100. Example 5: Inoculation of 10 × 1 ml of the sample yielded nine positive tubes – MPN/100 ml = 23 × 10 102 ×2.3 = and MPN/ml = 2.3
For other distributions, the formula below may be used, taken from Bacteriological Analytical Manual)Blodgett, 2010). The formula is indicated when just one dilution has positive tubes in a multiple dilution test, situation which is similar to the single dilution test.
MPN/g = (1/z) × 2.303 × Log10[(∑tjmj)/(∑ (tj − gj)mj)]
m = amount of sample in each tube of the selected dilution (the only one dilution in the single dilution test)
∑ tjmj = amount of sample in all tubes of the selected dilution
∑ (tj − gj)mj = amount of sample in all negative tubes of the selected dilution
Example 6: Inoculation of five aliquots of 25 ml yielding two positive flasks
m = 25 ml, ∑ tjmj = 125 ml, ∑ (tj − gj)mj = 75 ml
MPN/ml = (1/25) × 2.303 × Log10(125/75) = 0.02 or
MPN/100 ml = 2
. 2.2 Calculation for samples prepared by the surface swabbing or surface washing techniques
To calculate the results for samples prepared by the sur-face swabbing or surface washing techniques, follow the same instructions and guidelines provided for calculating the results of the multiple dilution test.
References
Silva, N.D .; Taniwaki, M.H. ; Junqueira, V.C.A.; Silveira, N.F.A. , Nasdcimento , M.D.D. and Gomes ,R.A.R .(2013) . Microbiological examination methods of food and water a laboratory Manual. Institute of Food Technology – ITAL, Campinas, SP, Brazil .
Thomas, H.A. (1942) Bacterial densities from fermentation tube tests. Journal of the American Water Works Association, 34, 572–576.
Halvorson, H.O. & Ziegler, N.R. (1933) Application of statistics to problems in bacteriology. Journal of Bacteriology, 25, 101–121.
Blodgett, R. (2010) Appendix 2 – Most Probable Number from Serial Dilutions. In: FDA (ed.) Bacteriological Analytical Manual, Appendix 2. [Online] Silver Spring, Food and Drug Administra-tion. Available from: http://www.fda.gov/Food/ScienceResearch/LaboratoryMethods/BacteriologicalAnalyticalManualBAM/ucm109656.htm [accessed 10th January 2012].
Annex 4.1 MPN tables
Table MPN-1 Most Probable Number (MPN) and 95 percent confidence intervals for three tubes each at 0.1, 0.01, and 0.001 g or ml inocula.
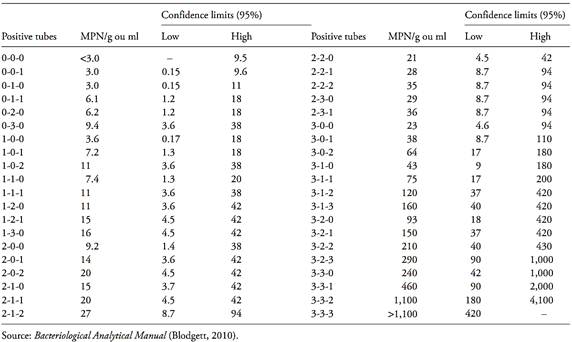
Table MPN-2 Most Probable Number (MPN) and 95 percent confidence intervals for five tubes each at 0.1, 0.01, and 0.001 g or ml inocula.
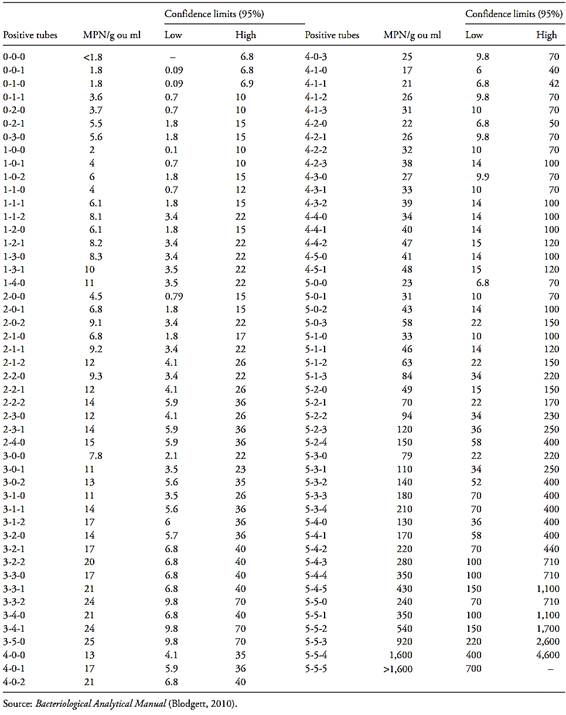
Table MPN-3 Most Probable Number (MPN) and 95 percent confidence intervals for 10 tubes at 10 ml inocula.
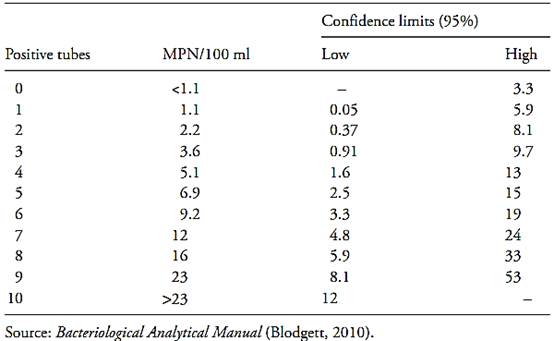
Table MPN-4 Most Probable Number (MPN) and 95 percent confidence intervals for five tubes at 20 ml inocula.
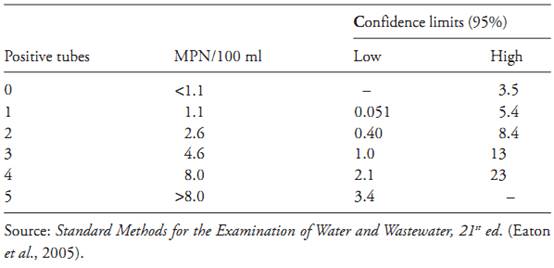
Table MPN-5 Most Probable Number (MPN) and 95 percent confidence intervals for five tubes at 10 ml inocula.


|
|
|
|
"وجه أوزمبيك".. تحذير من عرض غير متوقع لدواء إنقاص الوزن
|
|
|
|
|
|
|
"واتساب" يتوقف عن العمل في 3 هواتف شهيرة.. هل تمتلك أحدها؟
|
|
|
|
|
|
|
مدينة الفردوس الترفيهية توفر أكثر من 60 جلسة عائلية عامة وخاصة
|
|
|