تاريخ الرياضيات

الاعداد و نظريتها
تاريخ التحليل
تار يخ الجبر
الهندسة و التبلوجي
الرياضيات في الحضارات المختلفة
العربية
اليونانية
البابلية
الصينية
المايا
المصرية
الهندية
الرياضيات المتقطعة
المنطق
اسس الرياضيات
فلسفة الرياضيات
مواضيع عامة في المنطق
الجبر
الجبر الخطي
الجبر المجرد
الجبر البولياني
مواضيع عامة في الجبر
الضبابية
نظرية المجموعات
نظرية الزمر
نظرية الحلقات والحقول
نظرية الاعداد
نظرية الفئات
حساب المتجهات
المتتاليات-المتسلسلات
المصفوفات و نظريتها
المثلثات
الهندسة
الهندسة المستوية
الهندسة غير المستوية
مواضيع عامة في الهندسة
التفاضل و التكامل
المعادلات التفاضلية و التكاملية
معادلات تفاضلية
معادلات تكاملية
مواضيع عامة في المعادلات
التحليل
التحليل العددي
التحليل العقدي
التحليل الدالي
مواضيع عامة في التحليل
التحليل الحقيقي
التبلوجيا
نظرية الالعاب
الاحتمالات و الاحصاء
نظرية التحكم
بحوث العمليات
نظرية الكم
الشفرات
الرياضيات التطبيقية
نظريات ومبرهنات
علماء الرياضيات
500AD
500-1499
1000to1499
1500to1599
1600to1649
1650to1699
1700to1749
1750to1779
1780to1799
1800to1819
1820to1829
1830to1839
1840to1849
1850to1859
1860to1864
1865to1869
1870to1874
1875to1879
1880to1884
1885to1889
1890to1894
1895to1899
1900to1904
1905to1909
1910to1914
1915to1919
1920to1924
1925to1929
1930to1939
1940to the present
علماء الرياضيات
الرياضيات في العلوم الاخرى
بحوث و اطاريح جامعية
هل تعلم
طرائق التدريس
الرياضيات العامة
نظرية البيان

Central Tendency, Measures of
 المؤلف:
Byrkit, Donald
المؤلف:
Byrkit, Donald
 المصدر:
Statistics Today: A Comprehensive Introduction
المصدر:
Statistics Today: A Comprehensive Introduction
 الجزء والصفحة:
...
الجزء والصفحة:
...
 5-1-2016
 2837
2837


+
-
20
Any set of data consisting of numbers has important measurements that can be used to describe the entire set. One of these measurements is a single number that is considered the most representative of the set. Such a number is called “a measure of central tendency.” Three such measures are commonly used, and each has its own advantages. These measures are known as the mean, median, and mode.
For numerical data, the “mean” (sometimes called the arithmetic average or arithmetic mean because there are other measures in mathematics also called the mean) is the sum of the values in a data set divided by the total number of values. The “median” of a set of data is the middle piece of the data after the values have been sorted from smallest to largest (or largest to smallest). For a set of data with an odd number of values, the median is actually the middle data point. If a set of data has an even number of values, two numbers are considered to be in the middle of the data, and the median is halfway between these two middle data points. The “mode” is the value in the data set that appears most often. A set of data can have no mode, one mode, or two or more modes.
A Visual Example
Imagine that the following are data points in a set: 1, 1, 2, 3, 5, and 6. Now suppose that each number represents the number of hours six people exercise in a week. The goal is to select a single number that represents the central tendency for these values—in this case, the “average” number of hours of exercise in a week for this group of individuals. Next, visualize each of the values as a stack of cubes with a height equal to the value. For example, 1 would be represented by a single cube, 2 by a stack of two cubes, and soon. (See part (a) of the figure below.) What are the measures of central tendency for these data?
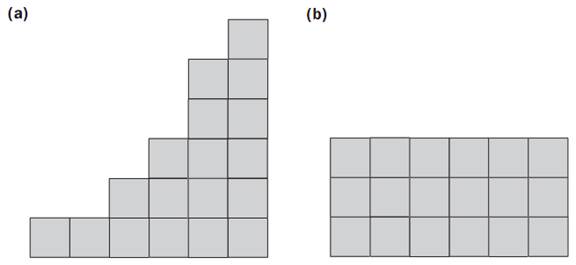
To measure the mean, think of the stacks as “sharing” cubes across the stacks so that they all have the same height. In this case, each of the stacks would be 3 cubes tall, and therefore the mean of these data is 3. In other words, 1+ 1 + 2 + 3 + 5 + 6 =18, and 18 ÷6 = 3. (See part (b) of the figure.)
To visualize the median—the middle value in a ranked data distribution—the cubes are arranged in order from the shortest to the tallest. The median is the height of the middle stack of cubes. Or in this case, with an even number of stacks, the arithmetic average (that is, the arithmetic mean) of the two middle stacks is the median. The two middle stacks have 2 and3 cubes each, and the mean, or halfway point, of 2 and 3 is 2 1/2 cubes [(2+
3) ÷ 2 =5 ÷ 2 =2 1/2].
To determine the mode—the most frequently occurring value in a data set—examine the distribution and look for stacks with equal height. In part (a), the first two stacks on the left are 1 cube tall. Since no other stacks have the same number of cubes, 1 is the mode for this data set.
The Impact of Outliers on the Mean
While measures of central tendency are useful in their ability to represent a large amount of information, they should always be interpreted carefully.
The mean is the measure of central tendency that is most frequently cited in popular usage of statistics, but it can be misleading without an understanding of how it was derived.
Imagine being told that the average salary for an employee at a ten-employee company is $75,000. This appears to be a large amount of money for the typical employee. However, suppose that this average included the high salaries of the president and chief executive officer. Management makes significantly more than the eight staff-level employees at this particular company. By including the two much higher values in the calculation of the mean salary, these two divergent values, known as outliers, will influence,or skew the mean toward a higher value, thereby suggesting that most stafflevel employees at the company make more money than they actually do.
In fact, none of the eight staff members in this example makes more than $40,000. Thus, the mean may not be the measure of central tendency most representative of a set of data.
Unlike the median and mode, which are much less influenced by extremely high or extremely low values in a set of data, the mean is easily influenced by such outliers. A divergence in a relatively small number of observations in a data set can change the mean value of the data set considerably. For instance, if the salaries of the president and chief executive officer in the previous example were removed, the mean salary for the other eight employees would decrease to $32,000.
The person who is calculating a measure of central tendency must therefore understand exactly what type of measure is desired; otherwise, the results and their interpretations can be misleading.
______________________________________________________________________________________________
Reference
Byrkit, Donald. Statistics Today: A Comprehensive Introduction. Menlo Park, CA: Benjamin/Cummings Publishing, 1987.
National Council of Teachers of Mathematics (NCTM). E-Examples 6.6 Page: Comparing Properties of the Mean and the Media with Technology. <http://standards.nctm
.org/documents/eexamples/chap6/6.6/index.html>.
 الاكثر قراءة في الاحتمالات و الاحصاء
 اخر الاخبار
اخبار العتبة العباسية المقدسة

الآخبار الصحية


 قسم الشؤون الفكرية يصدر كتاباً يوثق تاريخ السدانة في العتبة العباسية المقدسة
 "المهمة".. إصدار قصصي يوثّق القصص الفائزة في مسابقة فتوى الدفاع المقدسة للقصة القصيرة
 (نوافذ).. إصدار أدبي يوثق القصص الفائزة في مسابقة الإمام العسكري (عليه السلام)